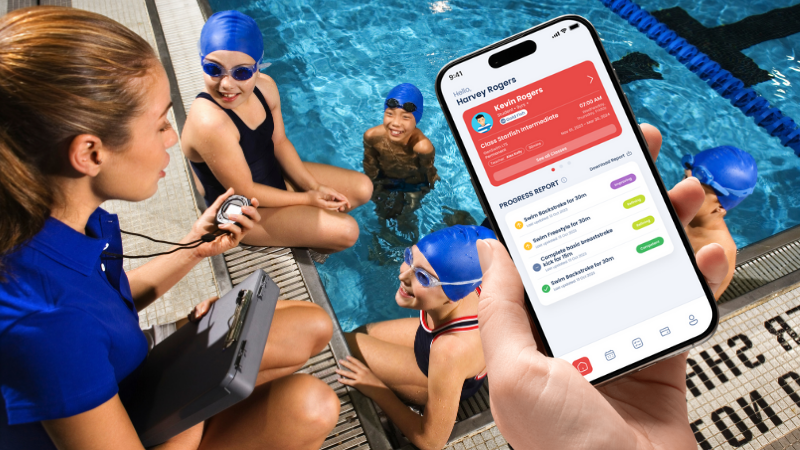
These metrics can help drive impressive growth
When it comes to running a successful swim school, most operators keep a close eye on key metrics like revenue, class capacity, and instructor hours. But some of the most powerful performance indicators are the ones that don’t always get the spotlight. These underrated KPIs can reveal how engaged your customers are, how healthy your enrolments are, and how efficiently your business is operating.
Here are three KPIs you should start tracking if you’re not already:
1. Attendance Percentage
How often are your swimmers actually showing up?
This metric measures the percentage of lessons attended out of the total possible lessons a student could have attended. For example, if a student has been enrolled for 10 lessons and has attended 8, their attendance percentage is 80%.
Why it matters:
High attendance indicates that customers are valuing the lessons, staying engaged, and getting results—leading to higher retention. On the other hand, if attendance drops, it could be a red flag that families are becoming disengaged, facing scheduling conflicts, or are at risk of dropping out altogether.
Pro tip:
Track this weekly or monthly and consider automated alerts for families falling below a certain attendance threshold. It’s also useful to monitor trends across instructors, class types, or time slots.
2. Active Enrolment Growth Rate
Are your numbers actually growing, or just cycling?
It’s easy to focus on total enrolments, but that number can be misleading if it’s hiding a high churn rate. Active enrolment growth rate measures the net increase (or decrease) in your currently enrolled students over time.
Why it matters:
This KPI reflects the real health of your swim school. If you’re constantly replacing lost customers with new ones just to stay level, that’s a churn treadmill. A positive active enrolment growth rate means your swim school is not only retaining students but also attracting more.
Pro tip:
Calculate this monthly to get a clear view of trends. A sudden dip might signal the need to boost retention efforts or review your onboarding experience.
3. Customer Portal Logins
Are your families using your tools—or relying on your front desk?
Tracking how often families log into your customer portal gives you a powerful insight into their level of self-sufficiency and engagement. A higher number of logins often correlates with proactive behaviour: checking schedules, marking absences, booking makeups, or updating payment details.
Why it matters:
If customers can self-serve effectively, it reduces admin workload, improves satisfaction, and keeps families more engaged with your swim school. Low login rates might indicate that your portal isn’t user-friendly or that customers aren’t aware of its features.
Pro tip:
Segment this data by family tenure or enrolment level to see which groups are more engaged. You can also tie it into your onboarding process—customers who log in early and often tend to stick around longer.
Final Thoughts
The most successful swim schools aren’t just watching what’s happening—they’re measuring why it’s happening. These three KPIs—attendance percentage, active enrolment growth rate, and customer portal logins—may not be the most obvious, but they offer deep insight into engagement, growth, and efficiency.
Start tracking them consistently, and you’ll be better equipped to make smart, data-driven decisions that keep your swim school thriving.
